Integrations & Observability
Monitor functional and performance tests in real time with StresStimulus's built-in dashboards, or extend visibility to your existing observability platforms through optional integrations.
StresStimulus collects metrics from both protocol and browser test cases to give engineering teams visibility into test activity and application behavior as tests execute. Monitor execution directly in StresStimulus or stream measurements to external observability platforms via OpenTelemetry, InfluxDB, and Azure Application Insights.
Monitor Test Execution in Real Time
Track application performance and identify problems while tests are running—out of the box.
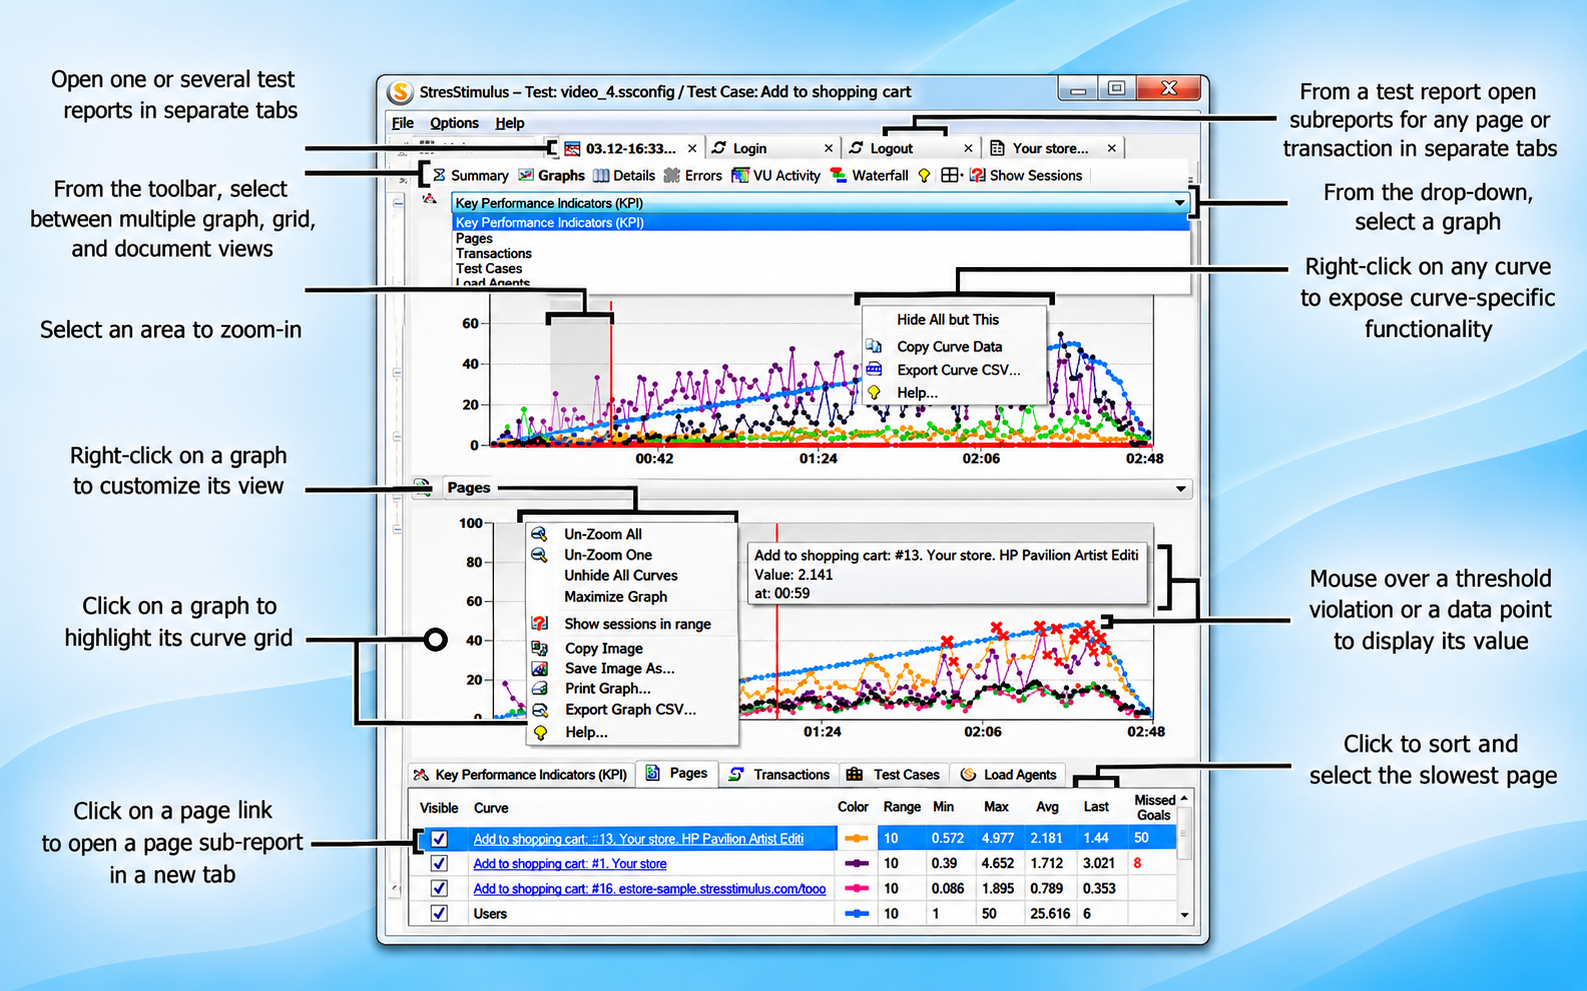
StresStimulus provides an embedded, real-time monitoring dashboard with live graphs for tracking active users, response times, throughput, transactions, and errors. Examine measurements at applicable test, test case, transaction, and request levels to identify slow or failing operations.
The configurable Runtime Dashboard combines a variable number of live graphs with detailed metric grids, test progress indicators, and optional agent and test case monitoring. Interactive graphs and grids let users inspect individual data points, zoom into selected time intervals, switch between views, and export selected measurements for further analysis. Built-in health indicators help detect load generator overload, while interactive controls let users pause or resume execution, adjust virtual user counts, skip pending requests, and stop or gracefully wind down a test, all without leaving the dashboard.
Send Test Metrics Where Your Team Already Monitors Performance
Give engineering teams live access to test measurements without requiring access to the StresStimulus interface.
StresStimulus continuously streams metrics from running functional and performance tests to connected external telemetry destinations. Multiple observers can monitor execution activity through their preferred dashboards, investigate changes, and configure alerts independently of the controller executing the test.
Telemetry streaming operates alongside StresStimulus's built-in monitoring and reporting, extending visibility to developers, DevOps teams, and other stakeholders.
Run Functional or Performance Tests
StresStimulus measures test, request, transaction, and iteration performance.
Stream Metrics in Real Time
Metrics are continuously sent using the configured telemetry destinations.
Monitor Externally
Use external platforms for dashboards and alerting.
Choose One Destination or Send Metrics to Several at Once
StresStimulus supports InfluxDB, OpenTelemetry (OTLP), and Azure Application Insights as telemetry destinations. Stream Common Performance Metrics from running Protocol and Playwright Browser Test Cases to one or multiple destinations simultaneously, each with its own connection settings and transmission interval.

InfluxDB
Send load-test metrics to an InfluxDB server for storage, analysis, and visualization, including Grafana dashboards.

OpenTelemetry (OTLP)
Send metrics using OTLP to collectors and compatible observability platforms.

Application Insights
Send performance telemetry to Azure Application Insights for monitoring within the Azure Monitor ecosystem.
Start with Datadog or Other OTLP-Compatible Platforms
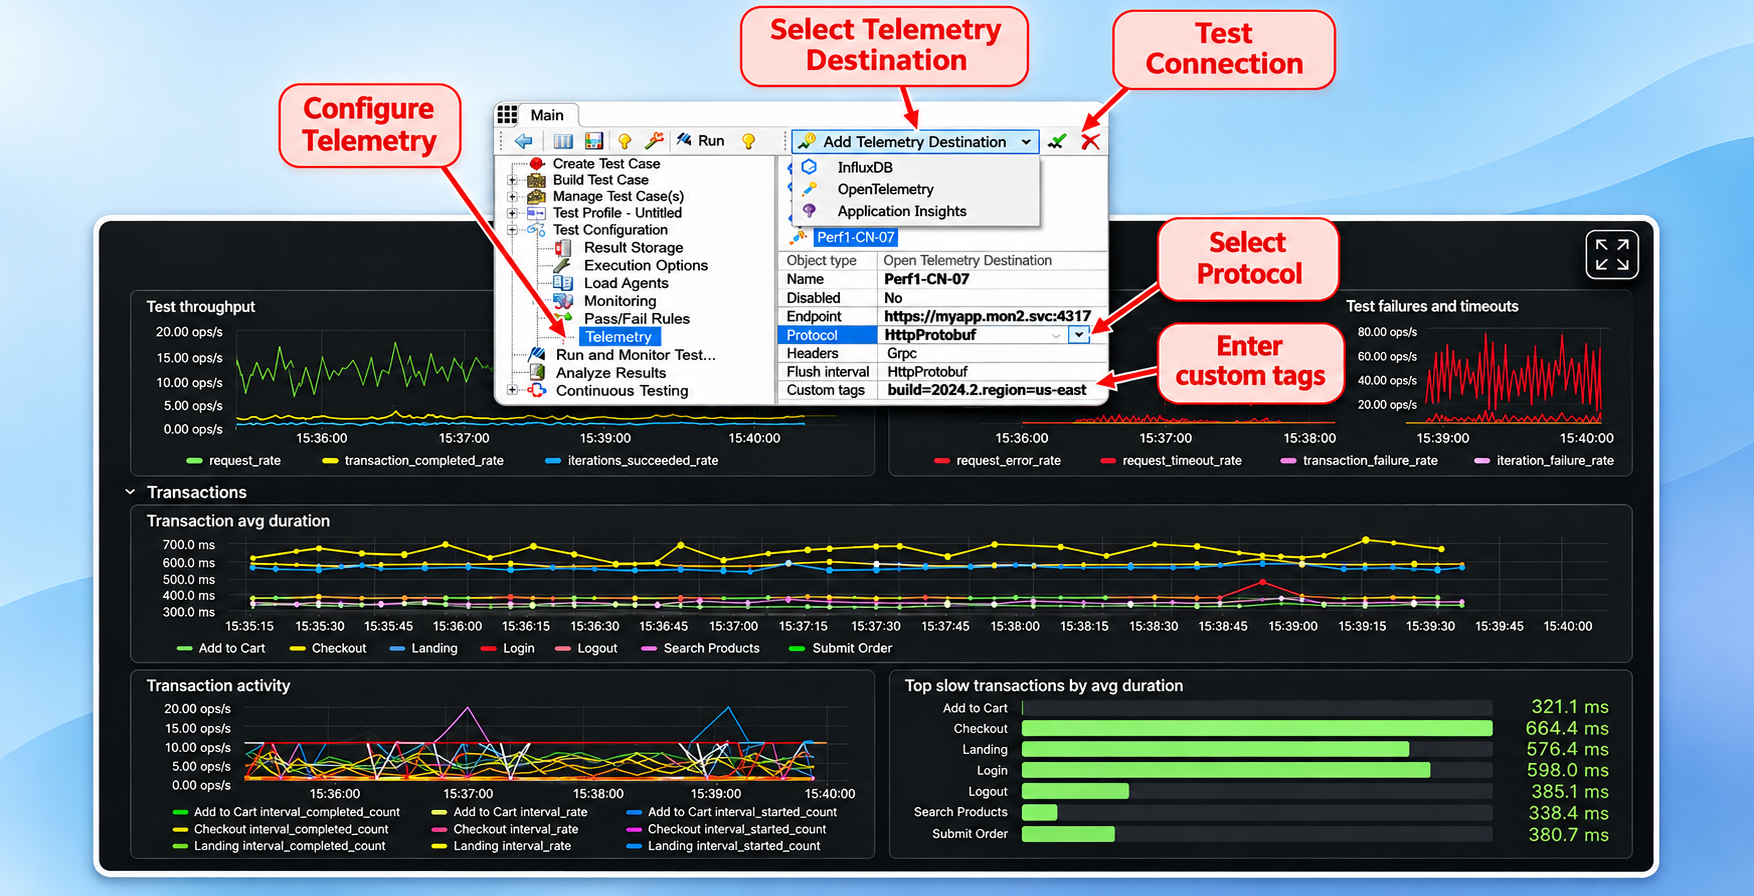
Configure an OTLP destination to send StresStimulus performance metrics to a collector or compatible endpoint, including Datadog, typically through a local Datadog Agent that forwards metrics to Datadog Cloud. Telemetry destinations are managed from the Telemetry node in the Workflow tree and can be verified before a load test begins.
StresStimulus
Capture performance and functional metrics from running Protocol and Browser Test Cases.
OTLP
Streams metrics through a standard telemetry protocol.
Observability Platform
Receives the telemetry for monitoring, dashboards, and alerts.
Connect Grafana Dashboards to StresStimulus Metrics
Visualize functional and performance test measurements without building dashboards from scratch.
StresStimulus provides ready-to-use Grafana dashboard templates for real-time visualization of Common Performance Metrics from Protocol and Playwright Browser Test Cases. Templates support InfluxDB and OTLP telemetry through Prometheus-compatible backends.
Export dashboard JSON from the StresStimulus Telemetry node, import it into Grafana, select the corresponding data source, and customize the dashboard for your team's monitoring needs.
Correlate Test Activity with Application and Infrastructure Behavior
Investigate performance problems using test measurements alongside application and infrastructure telemetry.
During test execution, StresStimulus streams performance measurements to external observability platforms where teams can examine them alongside available application, server, database, and infrastructure metrics.
Compare changes in transaction response times, throughput, and error rates with resource utilization and application activity during the same execution. This combined visibility helps teams investigate whether performance problems originate in the application, its dependencies, or the underlying infrastructure.
Use existing observability dashboards and alerting workflows to support collaborative investigation while StresStimulus continues executing the test.
Explore Related Topics
AI-Assisted Performance Diagnostics
Identify slow requests, transactions, server bottlenecks, and other performance problems using detailed test diagnostics.
Learn morePerformance Monitoring & Regression Testing
Track historical performance, detect regressions, and analyze longer-term trends across repeated test runs.
Learn moreContinuous Testing & CI/CD
Run StresStimulus tests automatically in delivery pipelines and use performance criteria as automated quality gates.
Learn moreBring Load-Test Metrics into Your Observability Workflow
Evaluate StresStimulus with your own application and see your performance metrics in the telemetry platforms your team already uses.